


How We Test Our Shilajit
- Home
- Shilajit Guide
- How we test
Testing & quality
Which laboratory, which method, and what the results actually say
Shilajit is one of the most adulterated supplements on the market. It's also one of the most tested by serious buyers. We think that's the right instinct, and we've designed our testing programme to hold up to scrutiny, not just to pass it.
Every origin we stock is independently tested by EkotechLAB Marek Klein S.K.A., a specialist analytical chemistry laboratory operating in Poland. EkotechLAB holds PCA accreditation (AB 1755) for specified methods under the ILAC-MRA framework. That recognition applies to results within its accredited scope, not automatically to every determination on every certificate. Below, we identify the accreditation status shown on the reports and flag where confirmation remains outstanding.
What follows is a record of the laboratory, analytical methods and current results for each One Life Foods Shilajit origin.
Contents
Why we chose EkotechLAB
Most supplement brands that test at all use one of the large international testing networks. Eurofins is the best known: by its own account a network of hundreds of laboratories across dozens of countries, handling very high volumes across food, pharmaceutical, environmental and consumer testing. It's a serious operation and we're not suggesting otherwise.
But a laboratory's name on a report doesn't tell you what you actually need to know, and this is where we think customers are misled by an entirely reasonable assumption. A familiar logo gets treated as a guarantee. What determines whether a result means anything is narrower than that: which analytical method was used, whether that specific test is accredited, and which site performed the work. All three are printed on the report. None of them are implied by the name at the top of it.
Fulvic acid is the clearest example. There's a reference method, ISO 19822:2018, aligned with International Humic Substances Society standards. There are also titration-based methods that are cheaper, faster, and systematically return much higher figures for the same material. Both can be run by reputable laboratories. So if a Shilajit certificate doesn't name ISO 19822:2018 on its method line, the percentage on it isn't comparable to the percentages on this page, whoever produced it. That's the check worth making, and it applies to our certificates exactly as much as to anyone else's.
We chose EkotechLAB because they're specialist analytical chemists rather than a generalist high-throughput operation. The analyses are carried out in their own facility, as their certificates state. Accredited methods are used where accreditation exists for them, and where it doesn't, the certificate says so plainly, which you can see for yourself on the mercury results further down this page. And when we ask a question about methodology or interpretation, we get a direct answer from people who ran the analysis.
That matters when you're trying to understand what a result actually means, not just whether it passes.
Applying that standard to ourselves
If the test is read the method line, we should be read the same way. Every EkotechLAB analysis on this page, the humic substances, minerals, heavy metals, solvents, PAHs and microbiology, was performed in their own laboratory.
Mycotoxin screening is the exception. We commission it through Nuscana Biotechnika Laboratoryjna, and their reports state that the analysis is subcontracted onward to a laboratory accredited under AB 1095. That's still an accredited method with the accreditation number printed on the document, which is the part that matters. But it's subcontracted, and we'd be doing exactly what we've just warned against if we let the name on the letterhead stand in for the arrangement behind it.
The analytical methods used for our results
Before you look at any results, it's worth understanding that not all Shilajit testing is equal, and that the method chosen to measure humic substances can change a reported figure dramatically.
Many people assume fulvic acid percentage is the headline measure of Shilajit quality. We think that framing is too narrow. The most meaningful picture of a Shilajit comes from reading the full spectrum of what has been measured: humic acids, fulvic acids, the mineral and trace element profile, and what the testing doesn't find as much as what it does. A single high fulvic acid figure tells you one thing. A complete analytical profile tells you considerably more.
That said, how fulvic acid is measured matters enormously. We use an analytical method aligned with the standards of the International Humic Substances Society (IHSS), implemented under ISO 19822:2018. This is the reference method used by the scientific community for humic substance analysis. It's precise, reproducible, and internationally recognised.
Many suppliers use titration-based methods instead. Titration measures anything that behaves chemically like a fulvic acid, including compounds that aren't fulvic acids at all. The result is a systematically inflated figure. A product tested by titration might report 80% fulvic acid. The same product tested under ISO 19822:2018 might return 40%. These numbers aren't comparable, and customers who try to compare fulvic acid percentages across brands without knowing the testing method used aren't comparing like with like.
The short version
Our results are lower than some you'll see advertised. That isn't a weakness. It reflects honest measurement.
What our testing programme covers
The full-spectrum picture
The ratio of humic to fulvic acids isn't just a quality measure. It's a characteristic of the resin itself, reflecting both the geology of the source region and the degree of processing applied to the raw material.
A higher fulvic acid percentage can indicate a more purified product. But aggressive purification and filtration to concentrate fulvic acids will typically reduce humic acid content and strip out a proportion of the naturally occurring mineral profile. Our Hunza results illustrate this clearly: 64.13% fulvic acid, but only 1.16% humic acid and a comparatively modest mineral profile. Our Hindu Kush shows a milder version of the same pattern, 59.53% fulvic against 10.40% humic with a notably lean mineral profile. Compare both to the Mongolian Altai at 10.19% humic and 51.93% fulvic, or the Siberian Altai at 5.8% humic and 41.19% fulvic, which retain richer mineral profiles alongside their fulvic acid content.
Whether that trade-off is desirable is an open scientific question. Our view is that the full-spectrum composition of the resin, humic acids, fulvic acids, and the mineral matrix together, is likely more meaningful than any single figure in isolation. We present the complete picture and let you decide.
Elemental profile as geographic fingerprint
The mineral composition of a Shilajit sample is one of the strongest indicators of its geographic origin. Different mountain ranges have fundamentally different geology, and the organic matter formed within them carries a distinct mineral signature as a result.
Iron in our Siberian Altai, at 923 mg/kg, is the highest across our range and reflects the ancient iron-rich Precambrian rock formations of the region. Boron works the other way: 142 mg/kg in the Kashmiri against 69 in the Mongolian Altai and 13 in the Hindu Kush, consistent with the evaporite and sedimentary character of the Kashmir basin.
Potassium and calcium separate the origins just as clearly. The Kashmiri returns 5.69% potassium and 2.81% calcium, and the Mongolian 3.59% and 2.96%. The Hindu Kush returns 0.62% and 685 mg/kg, roughly a fortieth of the calcium, which tells you as much about how the resin was purified as about where it came from.
Our earlier certificates for some origins included strontium, which is a useful marker for limestone-dominant geology. The September 2026 reports cover a different element panel and don't include it, so we've stopped citing a figure we can no longer evidence from a current report.
Siberian and Mongolian Altai share a mountain range, yet their profiles diverge. On the September 2026 analysis the Mongolian runs to 1,008 mg/kg phosphorus and 282 mg/kg aluminium, in both cases second to the Siberian Altai, while its sodium comes in at 142 mg/kg. The southern Mongolian section carries more sedimentary and volcanic influence than the Precambrian formations further north, and the mineral profiles reflect that. Note that the two were analysed on different element panels and in different years, so read them as profiles rather than as a like-for-like comparison.
A mineral profile that's inconsistent with the claimed origin is a meaningful red flag. One that's consistent with it isn't proof of authenticity on its own, but it's a supporting data point that an adulterated or mislabelled product would struggle to replicate convincingly.
How the origins compare on mineral content
People ask which of our origins carries the most minerals, so here are all five together, with the columns you need in order to read them fairly.
| Origin | Panel and date | Quantified | Total minerals | Potassium | Calcium |
|---|---|---|---|---|---|
| Siberian Altai | 18 elements, late 2025 | 16 of 18 | 11.11% | 6.81% | 3.39% |
| Kashmiri | 18 elements, Sept 2026 | 10 of 18 | 10.08% | 5.69% | 2.81% |
| Mongolian Altai | 18 elements, Sept 2026 | 10 of 18 | 8.25% | 3.59% | 2.96% |
| Hunza | 14 elements, early 2024 | 13 of 14 | 2.16% | 0.98% | 0.40% |
| Hindu Kush | 18 elements, Sept 2026 | 9 of 18 | 0.80% | 0.62% | 0.07% |
Totals add up every element the laboratory was able to quantify on that certificate. Elements reported as below a detection limit are left out, because below a limit isn't a number you can add up.
Four of the five were analysed on the same eighteen elements, so their totals can be read against each other directly. Hunza is the exception: its fourteen-element panel includes strontium and barium, which the others don't cover, and leaves out six trace elements that they do. Its total is a slightly different measurement rather than simply a smaller one.
The quantified column is worth a second look, because it moves for a reason that has nothing to do with the resin. The 2026 reports use a flat reporting limit of 10 mg/kg across seven trace elements, where the 2025 Siberian Altai analysis measured several of them individually: copper at 9 mg/kg, lithium at 6, nickel at 5, chromium at 4. Those six elements come to roughly 27 mg/kg between them. They change the count a great deal and the total almost not at all.
Dates differ too, and a certificate describes the batch it was drawn from rather than a period of time. Siberian Altai is from late 2025 and Hunza from early 2024, which we cover further down this page.
What this table isn't is a quality ranking. A higher mineral total isn't better the way a higher exam mark is better. It shows where a resin sits on the trade-off this page keeps coming back to: purification concentrates fulvic acids, and it strips mineral content and humic acids on the way. Our Hunza returns the highest fulvic figure in the range at 64.13%, and our Hindu Kush the lowest mineral total at 0.80%. Our Siberian Altai and Kashmiri sit at the other end, carrying more than twelve times the Hindu Kush mineral content at lower fulvic figures. None of those is the right answer. They're different resins, and which one suits you depends on what you're after.
Heavy metals
Lead, cadmium, mercury, arsenic, silver, chromium, copper, nickel and vanadium are tested across our range, although the exact panel and reporting limits vary by origin and certificate. The tables below show the results, including quantified values and those reported below laboratory limits. Appropriate thresholds and the sensitivity of each method matter when interpreting these results.
It's worth noting that trace arsenic levels, 0.7 mg/kg in our Siberian Altai, are geologically expected and not a cause for concern. The absence of any detectable arsenic in a product claiming Siberian origin would actually be the more suspicious result.
Mycotoxins
Mycotoxins are toxic compounds produced by certain moulds. They can be present in natural organic materials where moisture or inadequate handling during harvest or storage creates conditions for fungal growth. We test for aflatoxins B1, B2, G1 and G2, ochratoxin A, deoxynivalenol, and zearalenone on origins where the risk profile warrants it. All results have returned below detection limits. We're working towards extending mycotoxin screening across all origins as part of our ongoing quality programme.
Solvent residues (Siberian Altai)
One of the most common adulteration methods in the Shilajit market involves using organic solvents to extract or artificially concentrate fulvic acid content. We test for seven solvent compounds in our Siberian Altai. All returned below 10 mg/kg, the limit of detection for the method used. Clean solvent results are evidence of a genuine resin extraction process, not a solvent-assisted one.
Polycyclic aromatic hydrocarbons (Siberian Altai)
PAHs including benzo[a]pyrene, benzo[a]anthracene, benzo[b]fluoranthene and chrysene can enter Shilajit through improper drying or heating during processing. All four returned below 0.2 mg/kg. These results are a processing integrity marker as much as a safety one.
Microbiology (Siberian Altai)
Coliforms, Salmonella, coagulase-positive staphylococci, and yeast and mould counts were all tested. Salmonella wasn't detected. All other counts returned below 10 cfu/g.
Water content
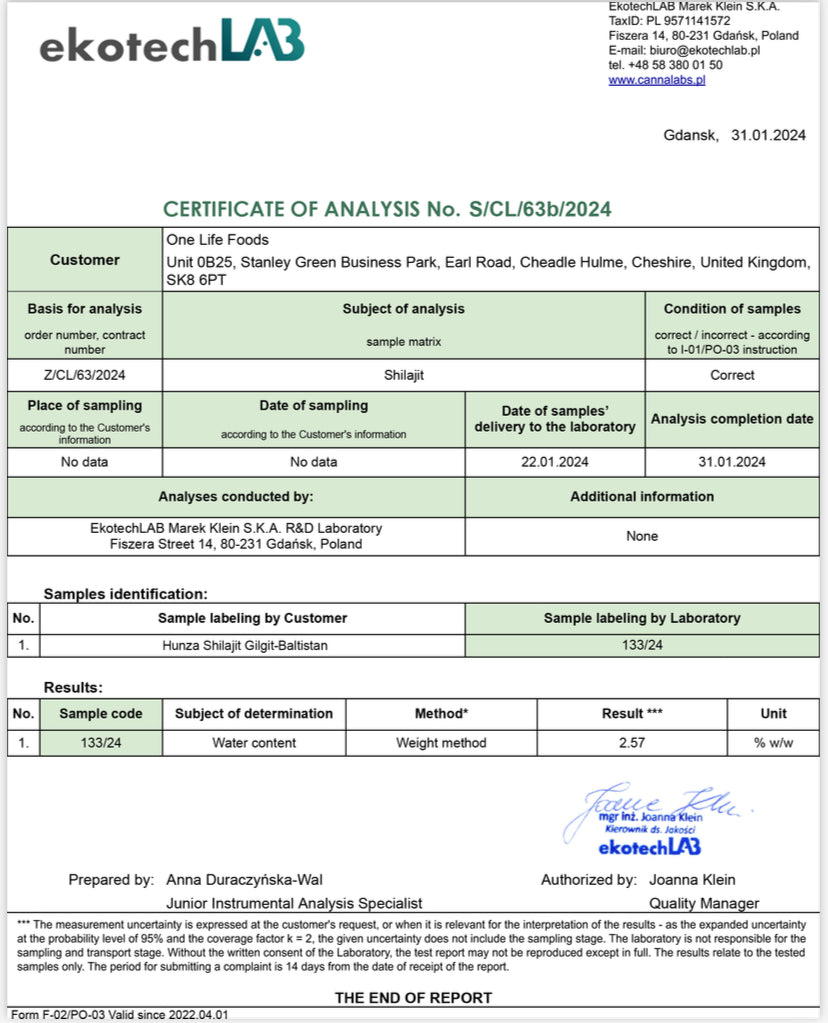
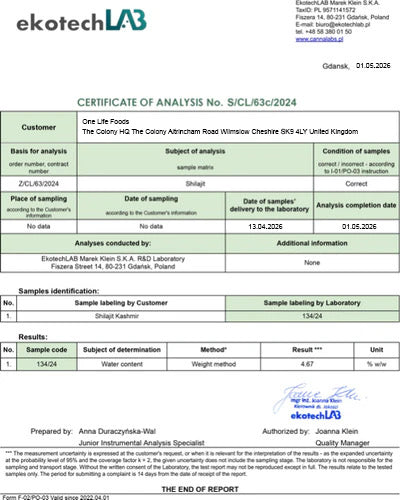
Water content affects concentration. A lower water content indicates a denser, more concentrated resin. Where it has been measured our results range from 2.57% in Hunza to 4.67% in Kashmiri. Water content wasn't included in the Siberian Altai analysis, and it's still outstanding for the Hindu Kush and the current Mongolian Altai batch; both are marked as pending in their sections below. A drier, firmer resin is sometimes mistaken by customers for a lower quality product. In fact, the opposite is generally true.
How to read the numbers below
Laboratory certificates report some elements as a percentage and others in mg/kg, depending on how much is present. That mixture is easy to misread. 0.17% is 1,700 mg/kg, so an element quoted in mg/kg can look larger than one quoted as a percentage that's actually several times more abundant.
We've kept each certificate's original figure and added a converted mg/kg column beside it, then sorted every table from most to least abundant. If you're comparing our numbers against another brand's, convert everything to one unit first. It's the single easiest way to be misled by a certificate that's telling the truth.
Why mercury is marked as not accredited
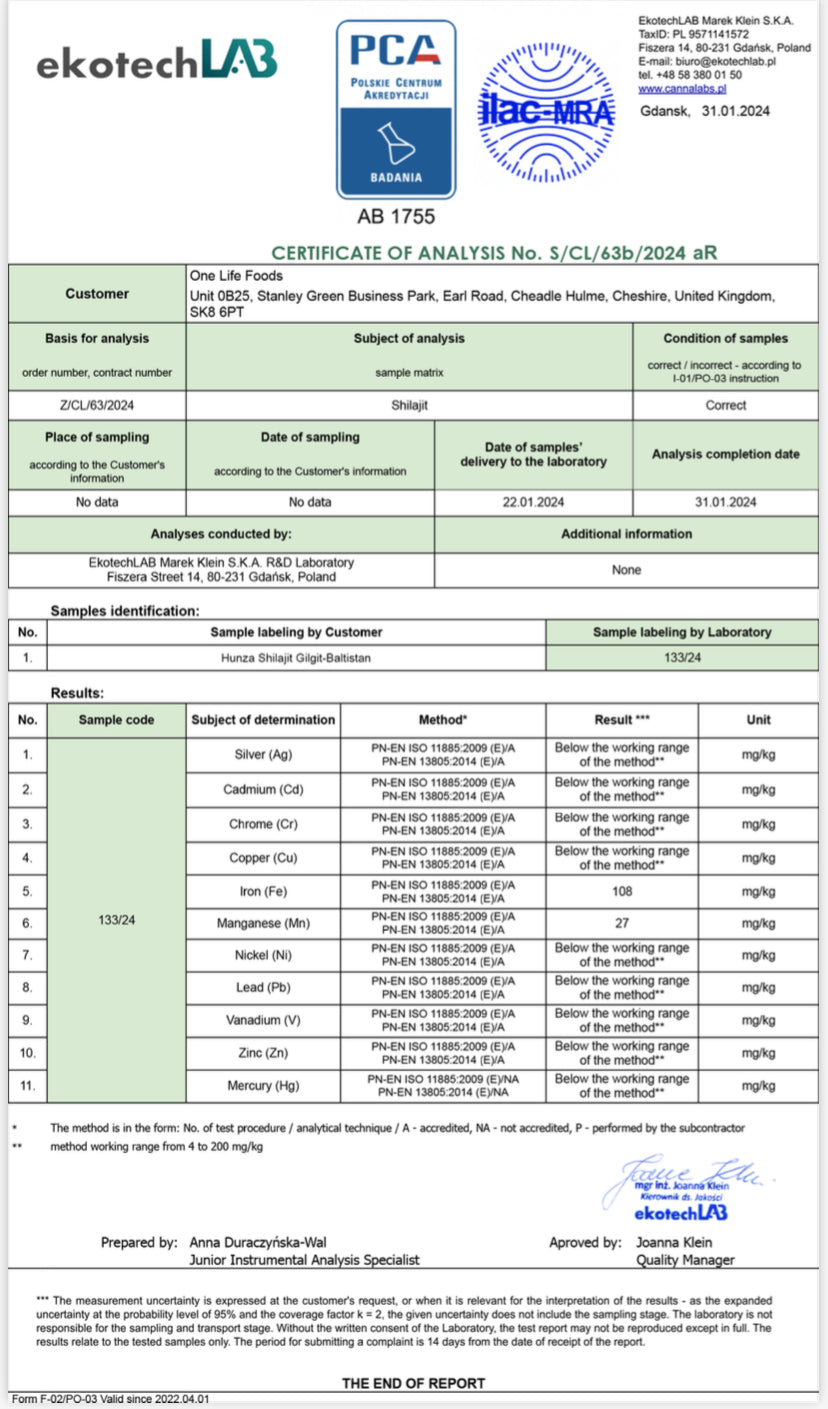
On the Hunza heavy metals certificate, and on the earlier Kashmiri and Mongolian certificates this page previously carried, ten elements are marked as accredited and one isn't. Mercury was measured alongside the others on the same multi-element method, but the certificate marks that particular determination NA, meaning EkotechLAB doesn't hold accreditation for mercury by that route.
Mercury is the difficult element for this kind of analysis. It's volatile, it can be lost during sample digestion, and it leaves memory effects in the instrument that carry between samples. For those reasons it's normally measured by a dedicated technique, such as cold vapour atomic absorption or thermal decomposition, rather than as one line on a general multi-element panel.
What that means for you: the mercury figure is a real measurement, produced by the same laboratory from the same digested sample, and it came back below the method's working range. It just doesn't carry the ILAC-MRA recognition the other ten results do. We'd rather show it and label it than quietly drop it or let the accredited heading cover it. We're asking EkotechLAB about adding a dedicated accredited mercury determination to future batches.
Why iron appears twice with different values
On some origins, iron and manganese appear in both the elemental profile and the accredited heavy metals certificate, with slightly different figures. These are separate analyses run under different methods and scopes, so small differences are expected. Where they differ, the accredited heavy metals result is the one to rely on for safety, and the elemental profile is the one to read for composition.
Our results by origin
Siberian Altai
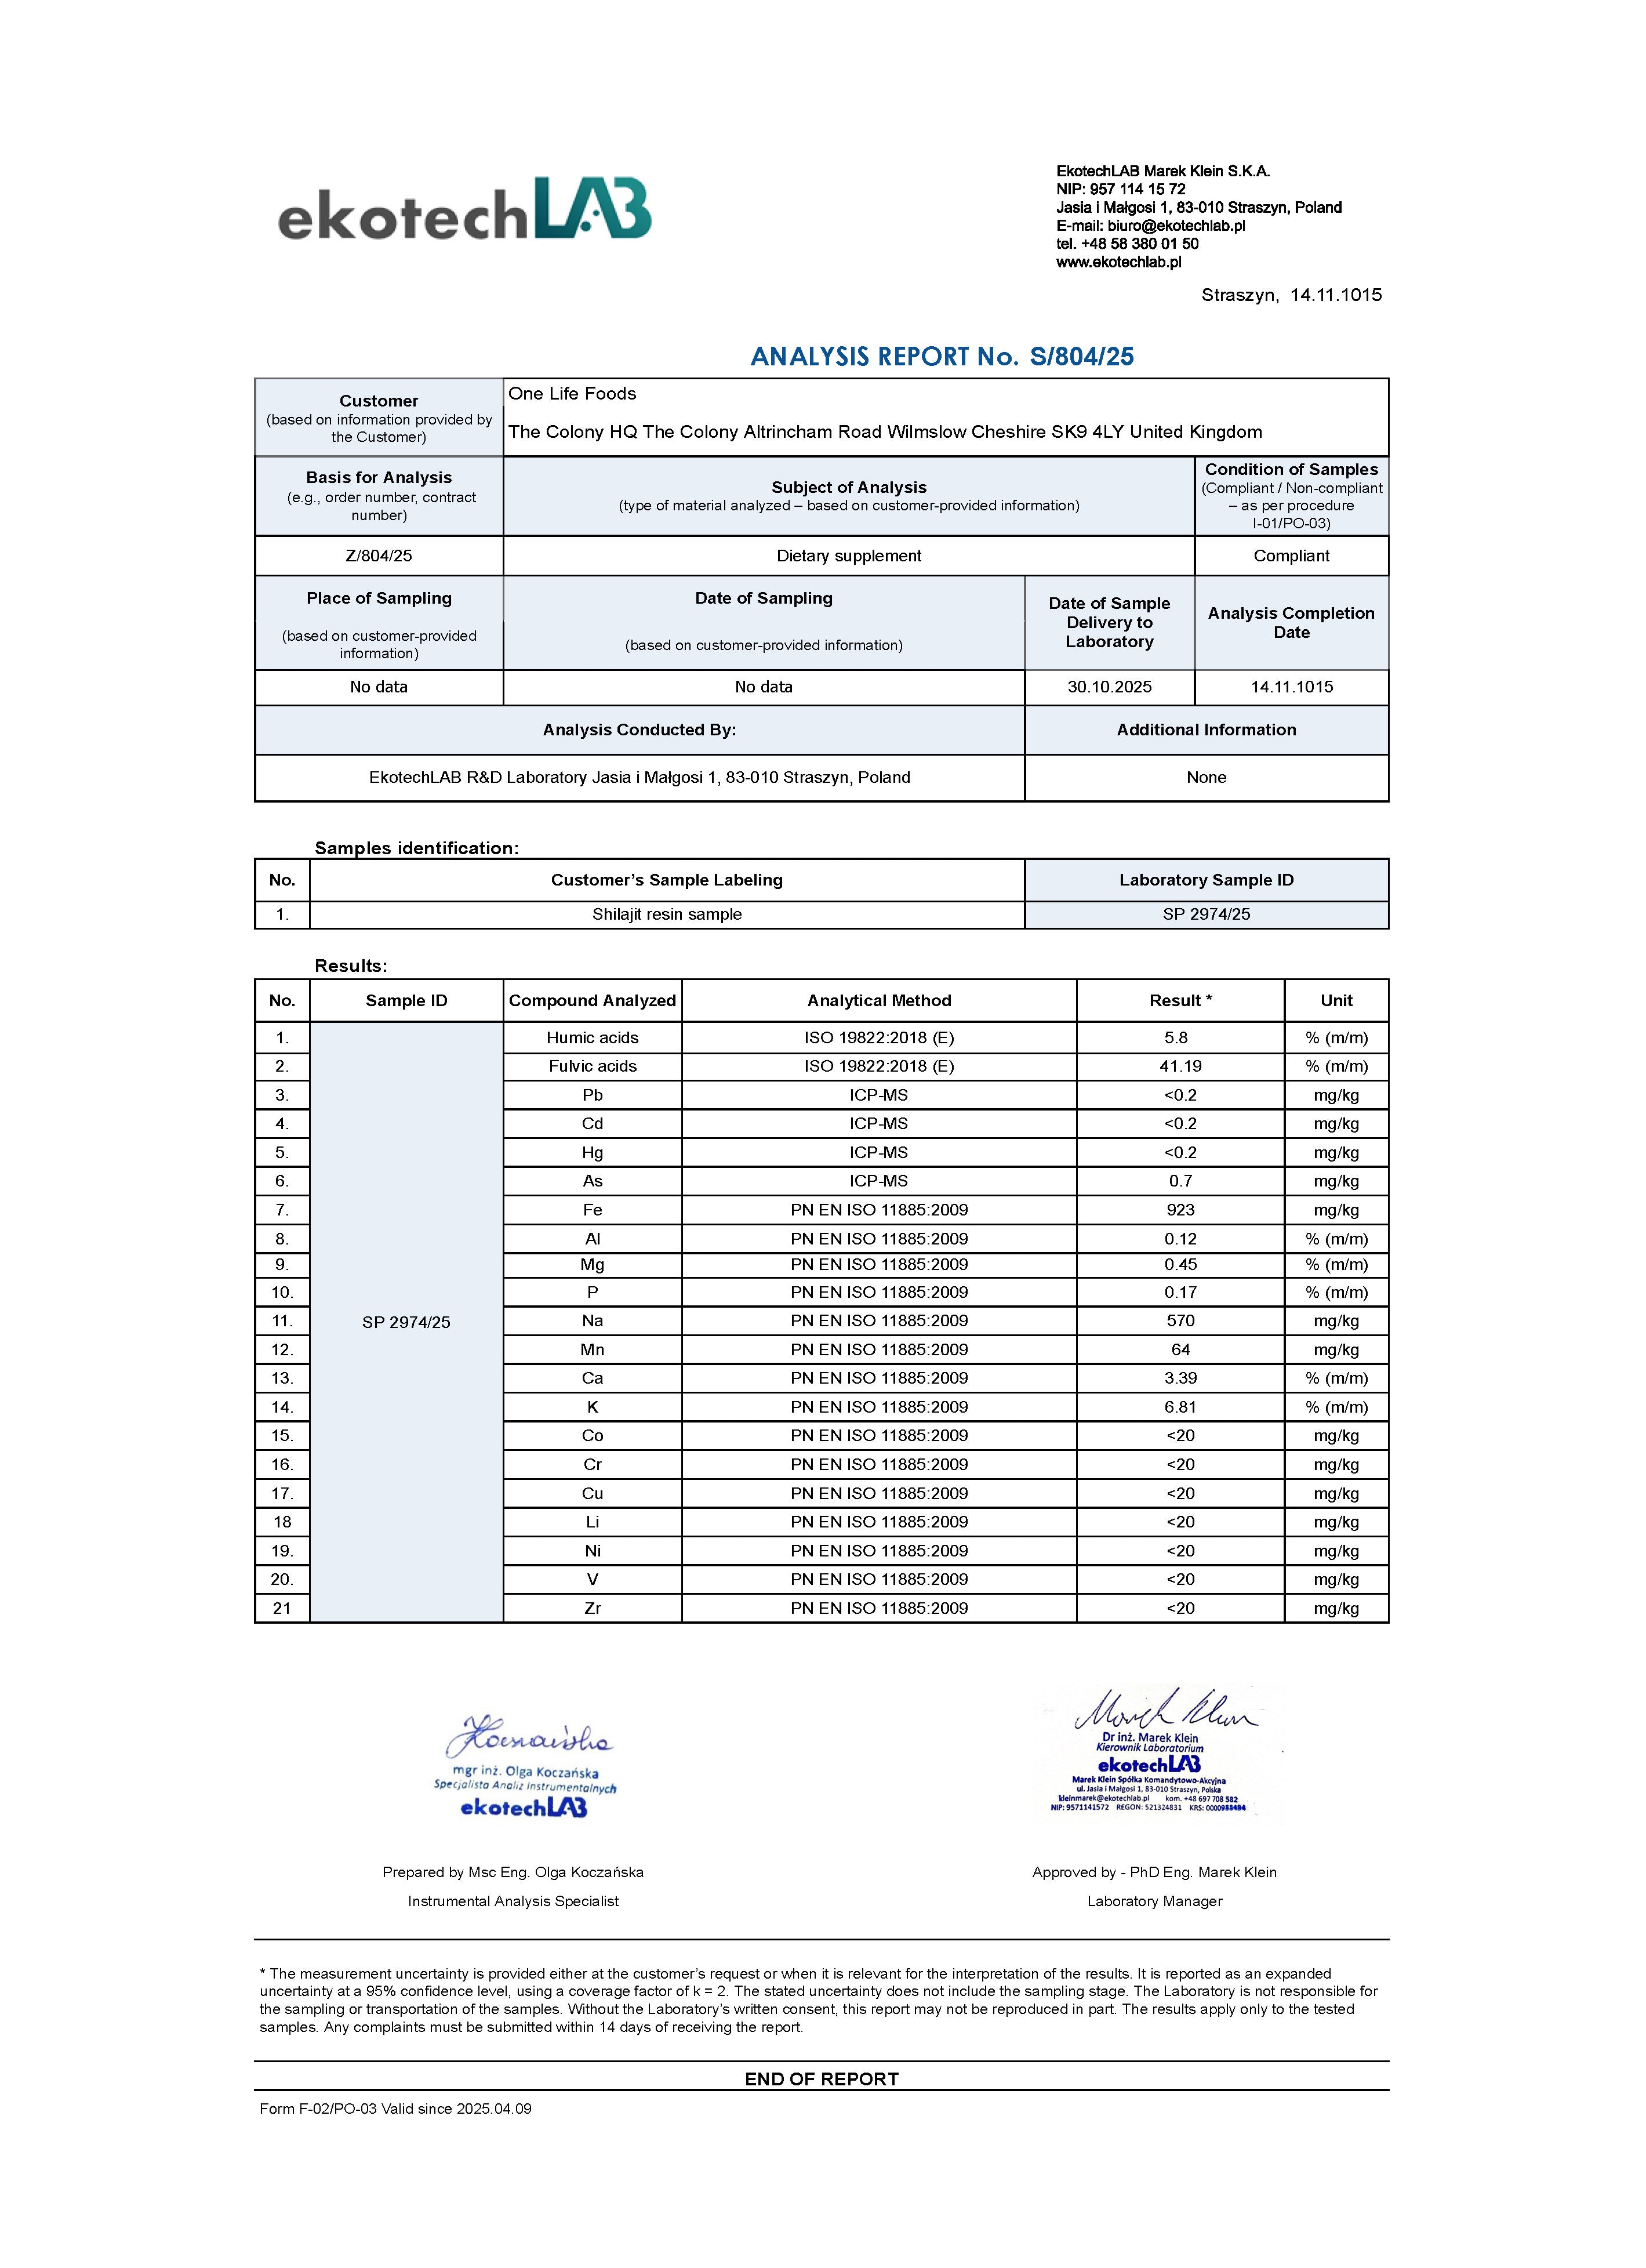
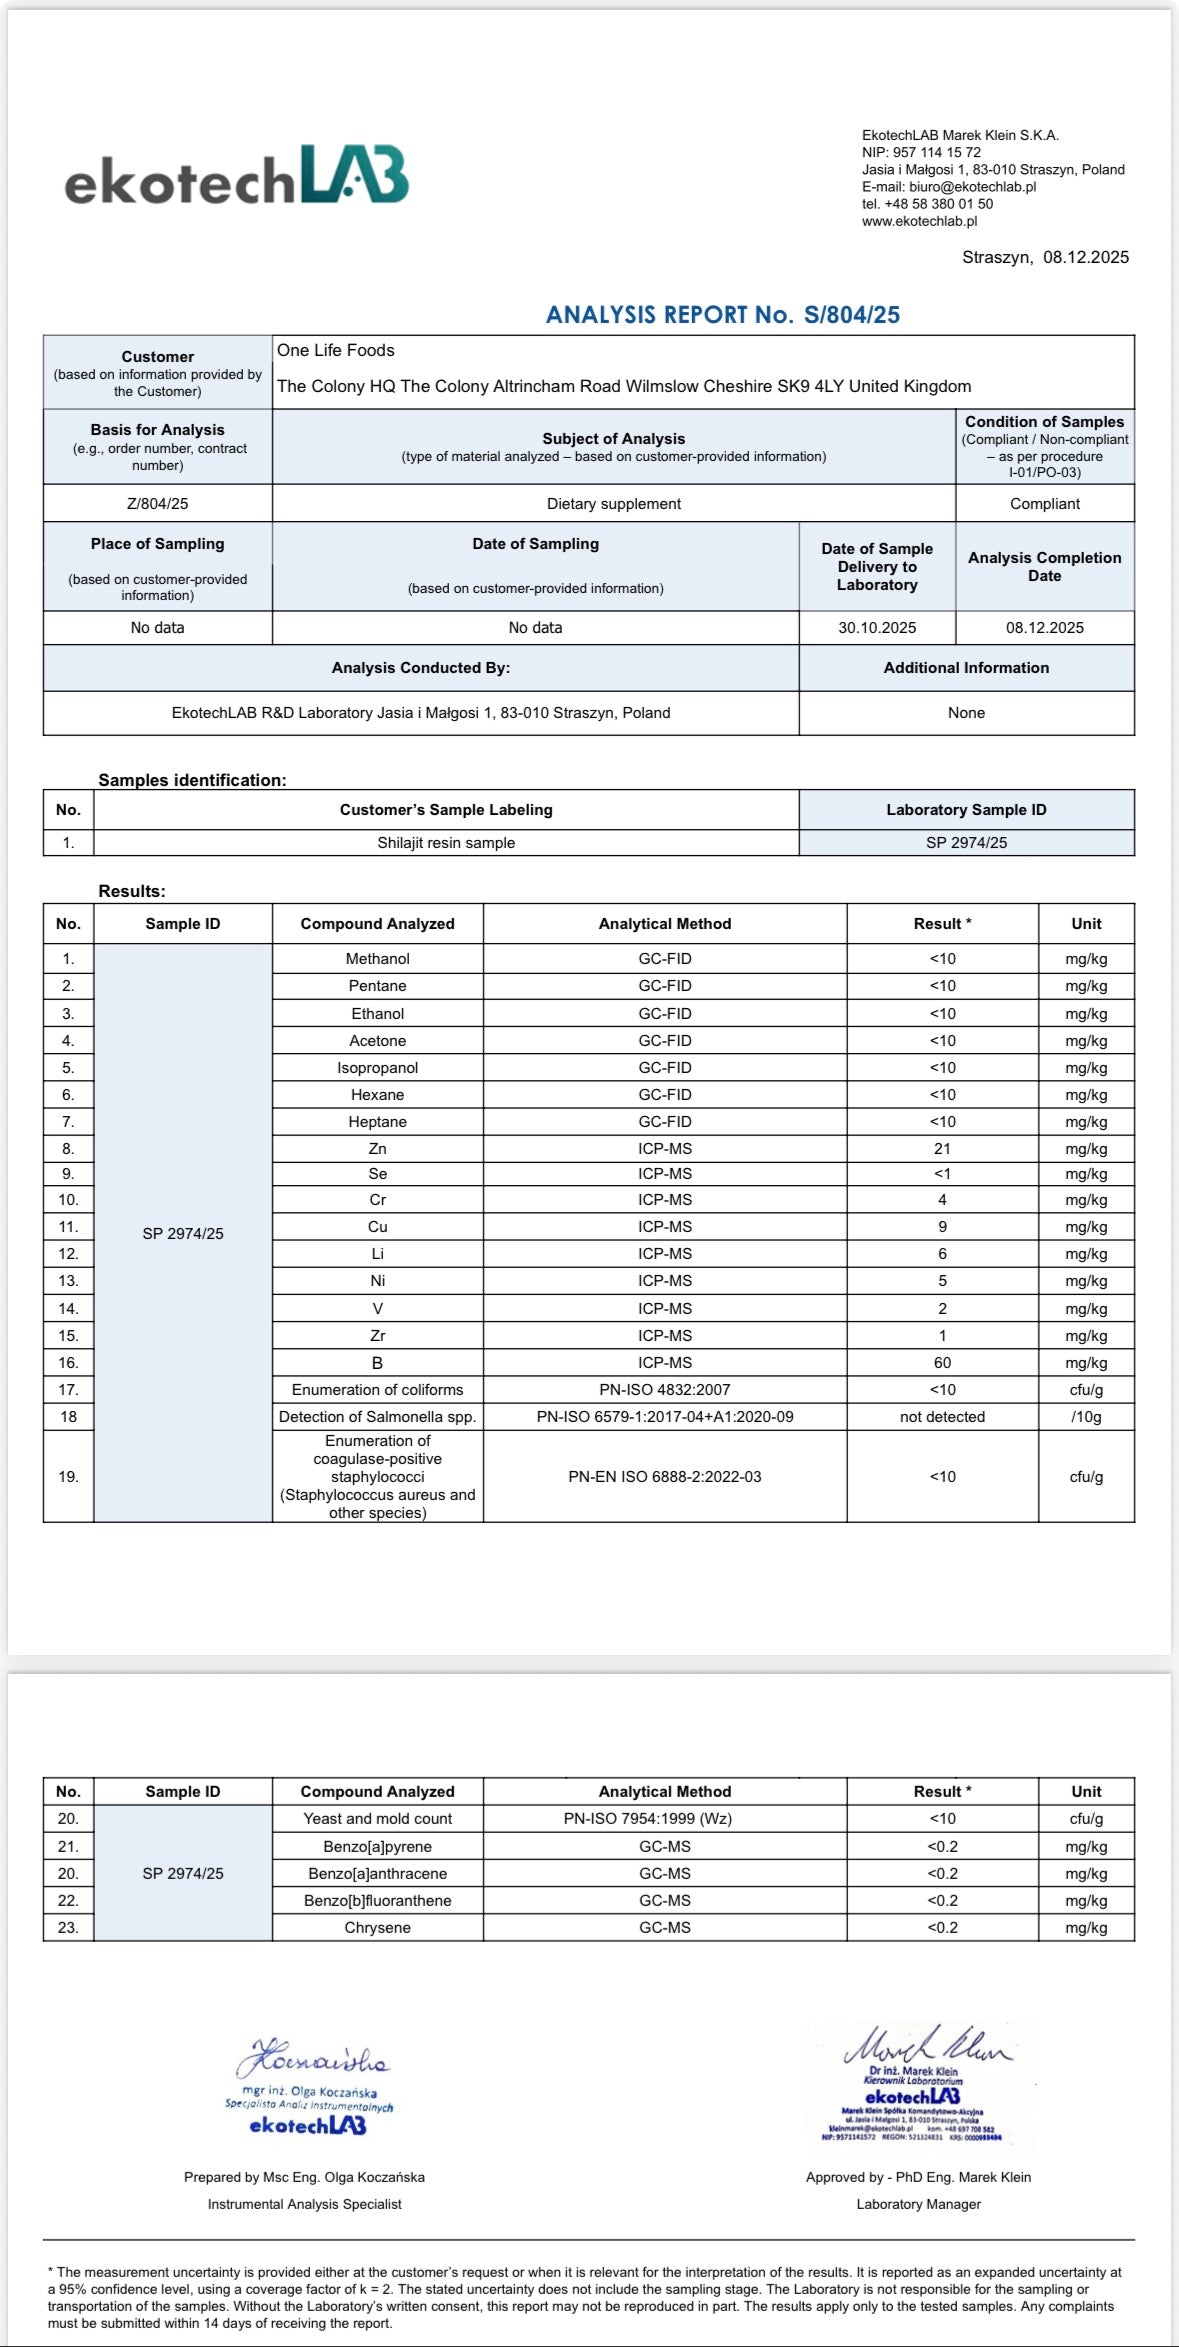
Tested by EkotechLAB, Gdansk, Poland. Analysis Reports S/804/25, completed November and December 2025.
The Siberian Altai sits on some of the oldest exposed geology on earth, ancient Precambrian and Palaeozoic rock formations that have produced a Shilajit with the broadest mineral spectrum of any origin we stock. The testing programme for this origin is our most comprehensive. Across two analysis reports it covers humic substances, eighteen minerals and four heavy metals, solvent residues, PAHs and microbiology.
| Compound | Result |
|---|---|
| Fulvic acids hydrophobic fraction | 41.19% m/m |
| Humic acids | 5.8% m/m |
| Compound | Method | As reported | mg/kg |
|---|---|---|---|
| Potassium (K) | PN EN ISO 11885:2009 | 6.81% m/m | 68,100 |
| Calcium (Ca) | PN EN ISO 11885:2009 | 3.39% m/m | 33,900 |
| Magnesium (Mg) | PN EN ISO 11885:2009 | 0.45% m/m | 4,500 |
| Phosphorus (P) | PN EN ISO 11885:2009 | 0.17% m/m | 1,700 |
| Aluminium (Al) | PN EN ISO 11885:2009 | 0.12% m/m | 1,200 |
| Iron (Fe) | PN EN ISO 11885:2009 | 923 mg/kg | 923 |
| Sodium (Na) | PN EN ISO 11885:2009 | 570 mg/kg | 570 |
| Manganese (Mn) | PN EN ISO 11885:2009 | 64 mg/kg | 64 |
| Boron (B) | ICP-MS | 60 mg/kg | 60 |
| Zinc (Zn) | ICP-MS | 21 mg/kg | 21 |
| Cobalt (Co) | PN EN ISO 11885:2009 | <20 mg/kg | <20 |
| Copper (Cu) | ICP-MS | 9 mg/kg | 9 |
| Lithium (Li) | ICP-MS | 6 mg/kg | 6 |
| Nickel (Ni) | ICP-MS | 5 mg/kg | 5 |
| Chromium (Cr) | ICP-MS | 4 mg/kg | 4 |
| Vanadium (V) | ICP-MS | 2 mg/kg | 2 |
| Zirconium (Zr) | ICP-MS | 1 mg/kg | 1 |
| Selenium (Se) | ICP-MS | <1 mg/kg | <1 |
Eighteen elements here, plus the four heavy metals below, across the two S/804/25 analysis reports. Potassium and calcium dominate by a wide margin, which the certificate's percentage figures make easy to miss.
A worked example of why method matters
Six of the elements above were measured twice. In the November analysis, under PN EN ISO 11885:2009, chromium, copper, lithium, nickel, vanadium and zirconium all returned the same result: less than 20 mg/kg. That method simply can't resolve anything below that threshold, so six different elements produced one identical, uninformative figure.
We commissioned a second analysis by ICP-MS, which is far more sensitive. The same six elements returned 4, 9, 6, 5, 2 and 1 mg/kg. The resin hadn't changed. Only the instrument had.
This is the point we make throughout this site, using our own certificates: a number without its method attached tells you very little. Cobalt is the one element we haven't yet re-run by ICP-MS, which is why it still reads <20 mg/kg rather than a specific figure. We'll update it when we do.
The iron content of 923 mg/kg is notably high and consistent with the ancient iron-rich rock of the Siberian Altai region. It's the highest iron result of the five origins we stock, and the breadth of the profile, sixteen of eighteen elements quantified, reflects the geological complexity of the source formation.
| Compound | Result |
|---|---|
| Lead (Pb) | <0.2 mg/kg |
| Cadmium (Cd) | <0.2 mg/kg |
| Mercury (Hg) | <0.2 mg/kg |
| Arsenic (As) | 0.7 mg/kg |
| Compound | Result |
|---|---|
| Methanol | <10 mg/kg |
| Pentane | <10 mg/kg |
| Ethanol | <10 mg/kg |
| Acetone | <10 mg/kg |
| Isopropanol | <10 mg/kg |
| Hexane | <10 mg/kg |
| Heptane | <10 mg/kg |
| Compound | Result |
|---|---|
| Benzo[a]pyrene | <0.2 mg/kg |
| Benzo[a]anthracene | <0.2 mg/kg |
| Benzo[b]fluoranthene | <0.2 mg/kg |
| Chrysene | <0.2 mg/kg |
| Compound | Method | Result |
|---|---|---|
| Coliforms | PN-ISO 4832:2007 | <10 cfu/g |
| Salmonella spp. | PN-ISO 6579-1:2017-04+A1:2020-09 | Not detected in 10 g |
| Staphylococcus (coagulase-positive) | PN-EN ISO 6888-2:2022-03 | <10 cfu/g |
| Yeast and mould | PN-ISO 7954:1999 (Wz) | <10 cfu/g |
Laboratory-recorded sample condition on receipt: Compliant
Hunza (Gilgit-Baltistan, Karakoram Range)
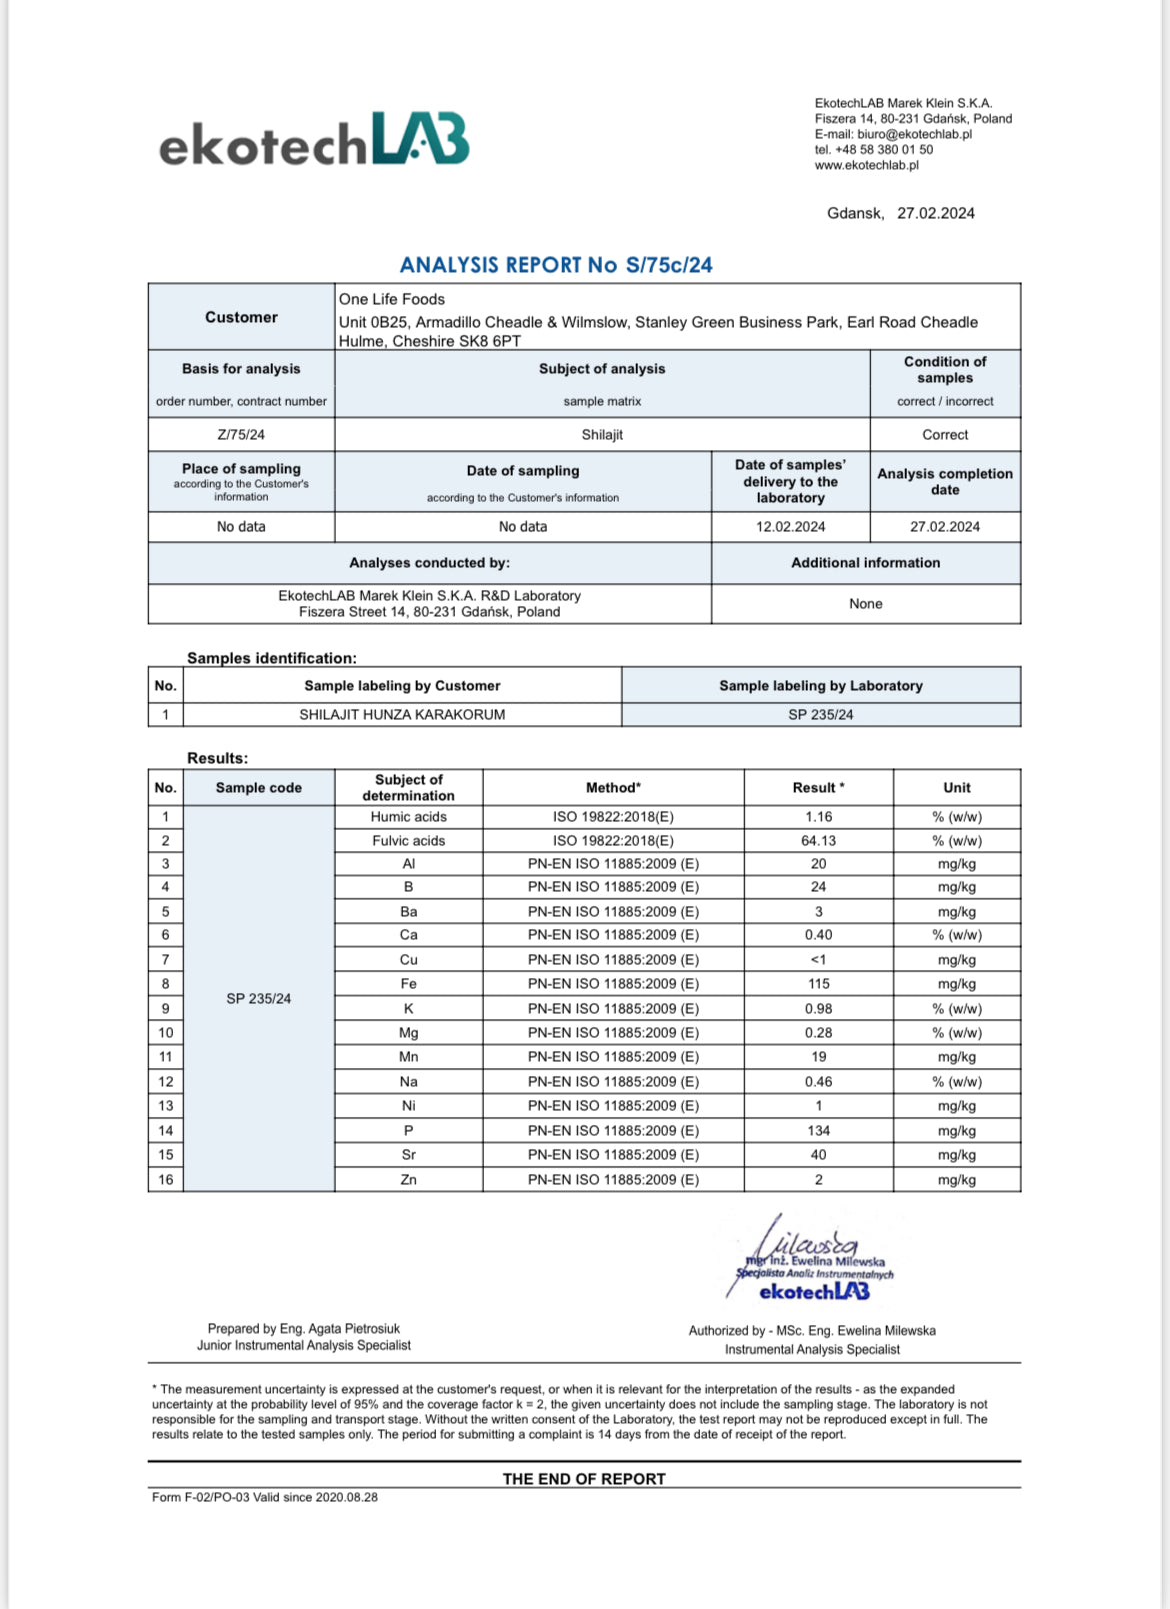
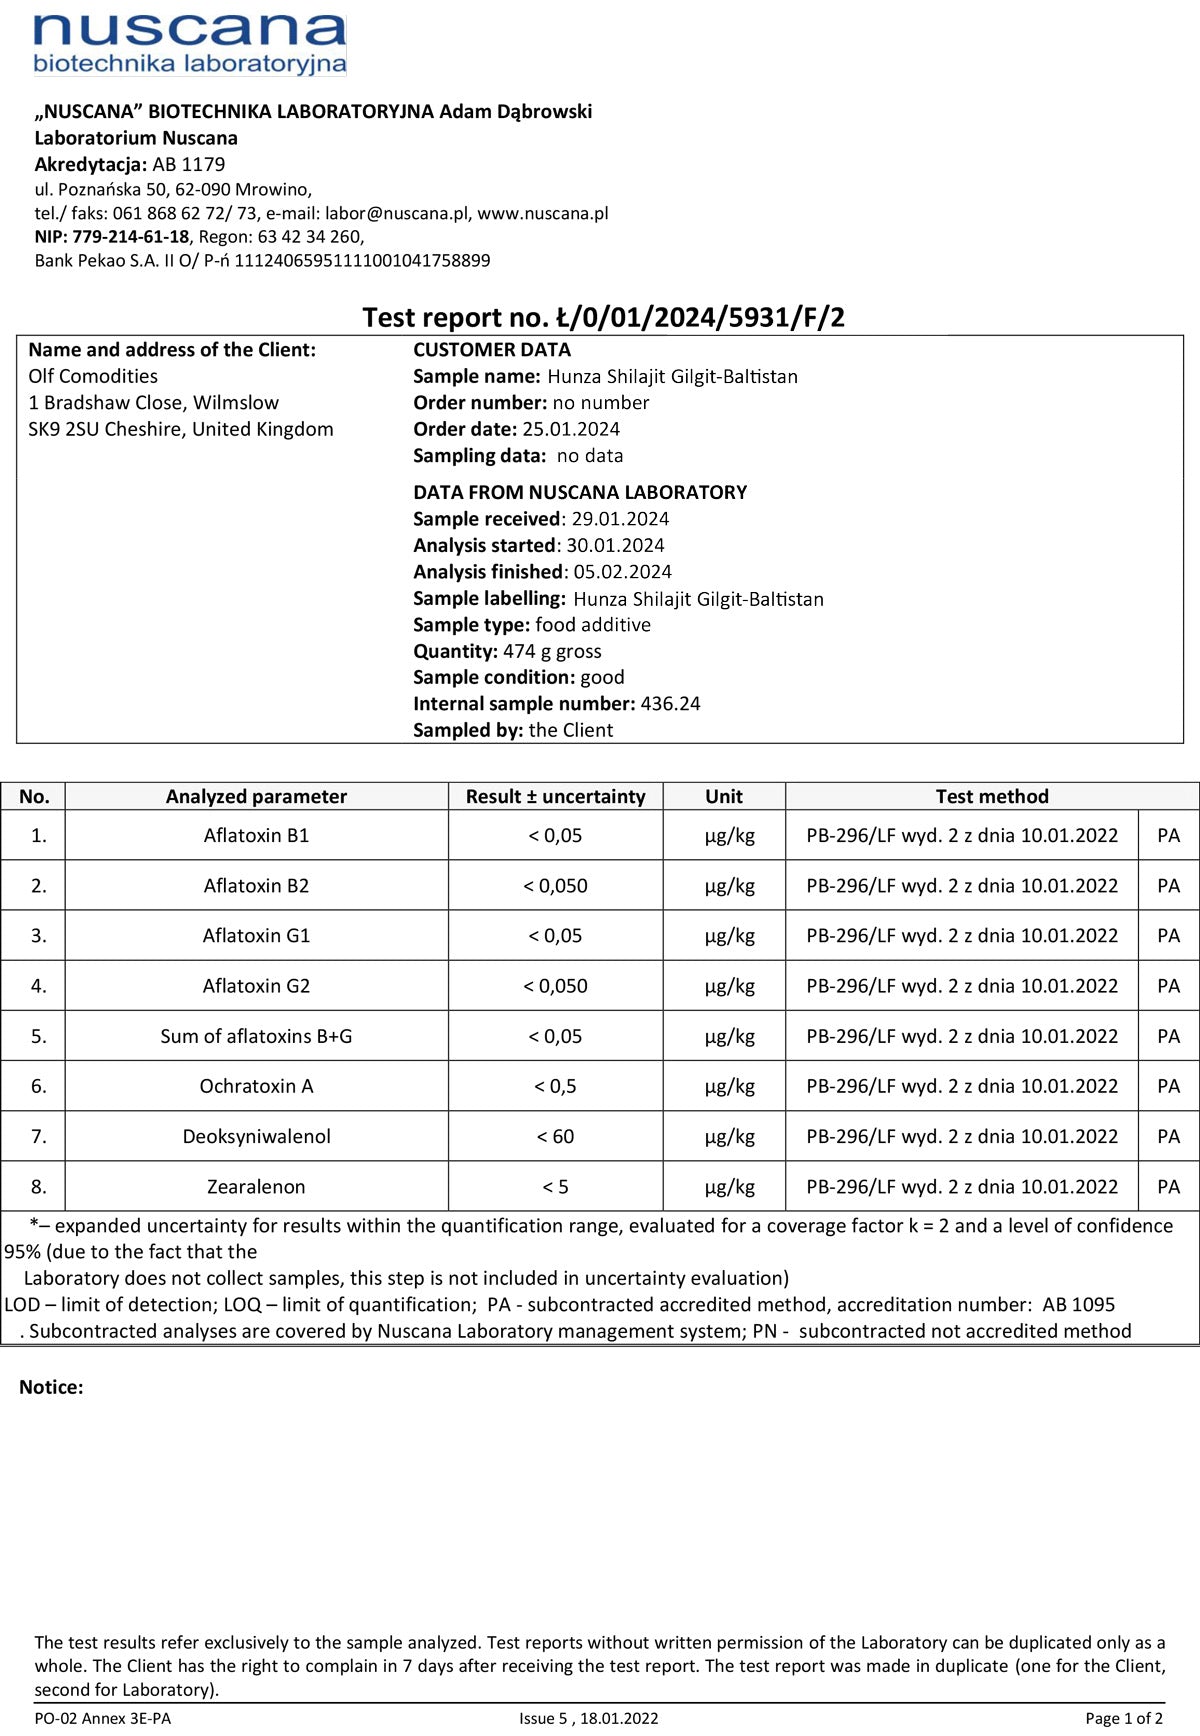
Tested by EkotechLAB, Gdansk, Poland. Certificate S/CL/63b/2024 aR for heavy metals and Certificate S/CL/63b/2024 for water content, both completed 31 January 2024. Analysis Report S/75c/24 for humic substances and minerals, completed 27 February 2024. Mycotoxin screening arranged by Nuscana Biotechnika Laboratoryjna, report Ł/0/01/2024/5931/F/2, completed 5 February 2024.
Hunza Shilajit originates from the Karakoram range in Gilgit-Baltistan, one of the most geologically distinct mountain systems on earth, dominated by metamorphic and igneous rock including granite, gneiss and schist. The mineral signature of this origin reflects that geology: lower calcium than the sedimentary Kashmir origin, and a mineral profile that's characteristically consistent with Karakoram geology. One figure stands out. Sodium at 0.46% is the highest in our range by a wide margin, roughly eight times the Siberian Altai and forty times the Kashmiri.
The fulvic acid concentration of 64.13% under ISO 19822:2018 is the highest of any origin we stock. A high fulvic acid figure with a very low humic acid figure (1.16%) and a comparatively modest mineral profile suggests a more purified resin, one in which the purification process has concentrated fulvic acids at the partial expense of humic acids and some mineral content. If fulvic acid concentration is your primary consideration, this is our highest. If you value the full-spectrum composition of a less processed resin, the Kashmiri or Siberian Altai may suit you better. We think it's important to say that plainly.
| Compound | Result |
|---|---|
| Fulvic acids hydrophobic fraction | 64.13% w/w |
| Humic acids | 1.16% w/w |
| Compound | Method | As reported | mg/kg |
|---|---|---|---|
| Potassium (K) | PN-EN ISO 11885:2009 (E) | 0.98% w/w | 9,800 |
| Sodium (Na) | PN-EN ISO 11885:2009 (E) | 0.46% w/w | 4,600 |
| Calcium (Ca) | PN-EN ISO 11885:2009 (E) | 0.40% w/w | 4,000 |
| Magnesium (Mg) | PN-EN ISO 11885:2009 (E) | 0.28% w/w | 2,800 |
| Phosphorus (P) | PN-EN ISO 11885:2009 (E) | 134 mg/kg | 134 |
| Iron (Fe) | PN-EN ISO 11885:2009 (E) | 115 mg/kg | 115 |
| Strontium (Sr) | PN-EN ISO 11885:2009 (E) | 40 mg/kg | 40 |
| Boron (B) | PN-EN ISO 11885:2009 (E) | 24 mg/kg | 24 |
| Aluminium (Al) | PN-EN ISO 11885:2009 (E) | 20 mg/kg | 20 |
| Manganese (Mn) | PN-EN ISO 11885:2009 (E) | 19 mg/kg | 19 |
| Barium (Ba) | PN-EN ISO 11885:2009 (E) | 3 mg/kg | 3 |
| Zinc (Zn) | PN-EN ISO 11885:2009 (E) | 2 mg/kg | 2 |
| Nickel (Ni) | PN-EN ISO 11885:2009 (E) | 1 mg/kg | 1 |
| Copper (Cu) | PN-EN ISO 11885:2009 (E) | <1 mg/kg | <1 |
Fourteen elements. Note how much smaller the trace fraction is here than in the Siberian Altai profile once the percentages are converted, which is what a more heavily purified resin looks like.
| Compound | Accredited | Result |
|---|---|---|
| Silver, cadmium, chromium, copper, nickel, lead, vanadium, zinc | Yes | Below 4 mg/kg |
| Mercury (Hg) | No | Below 4 mg/kg |
| Iron (Fe) | Yes | 108 mg/kg |
| Manganese (Mn) | Yes | 27 mg/kg |
| Compound | Result |
|---|---|
| Aflatoxin B1 | <0.05 µg/kg |
| Aflatoxin B2 | <0.050 µg/kg |
| Aflatoxin G1 | <0.05 µg/kg |
| Aflatoxin G2 | <0.050 µg/kg |
| Sum of aflatoxins B+G | <0.05 µg/kg |
| Ochratoxin A | <0.5 µg/kg |
| Deoxynivalenol | <60 µg/kg |
| Zearalenone | <5 µg/kg |
| Compound | Result |
|---|---|
| Water content | 2.57% w/w |
The lower of the two origins where water content has been measured, indicating a dense, concentrated resin.
Laboratory-recorded sample condition on receipt: Correct
Kashmiri
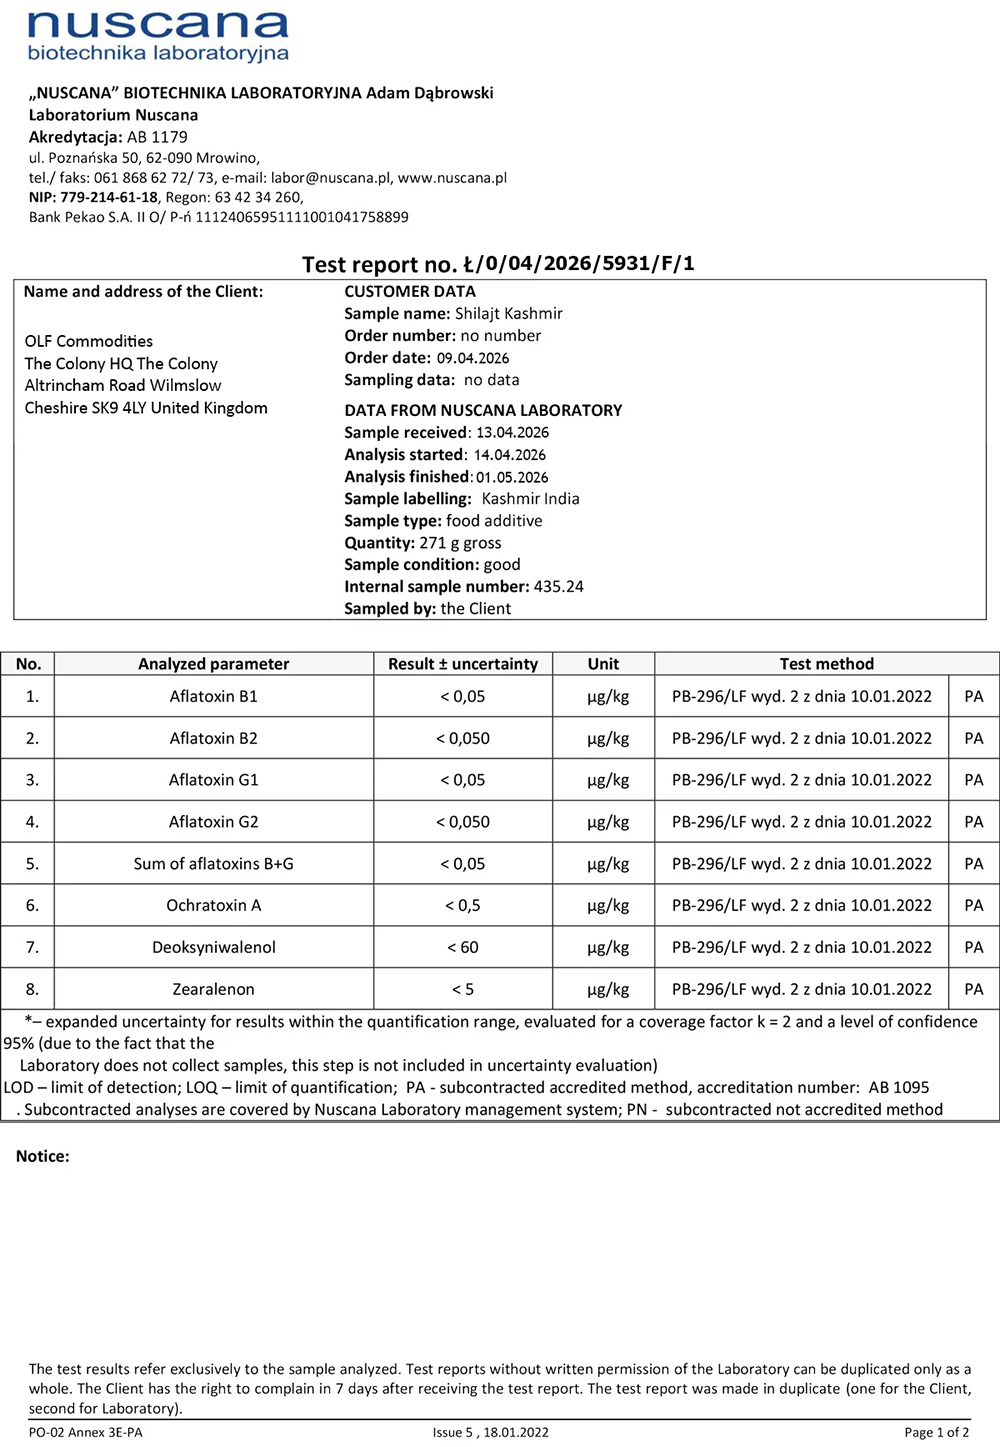
Humic substances, minerals and heavy metals: EkotechLAB R&D Laboratory, Straszyn, Poland, Analysis Report S/572a/26, laboratory sample SP 1668/26, customer labelling KASHMIR. Sampled and delivered 1 September 2026, completed 18 September 2026. Water content: EkotechLAB Marek Klein S.K.A., Gdansk, Certificate of Analysis S/CL/63c/2024, laboratory sample 134/26, completed 1 May 2026. Mycotoxin screening: Nuscana Biotechnika Laboratoryjna, report Ł/0/04/2026/5931/F/1, internal sample 435.26, completed 1 May 2026. The water content and mycotoxin results are from an earlier batch than the September 2026 analysis and are shown with their own sample references for that reason.
The Kashmir Valley sits within a sedimentary basin formed from ancient limestone and sandstone laid down over millions of years. The organic matter that forms Shilajit in this region carries the geochemical signature of those carbonate-rich formations, and the September 2026 analysis shows it clearly: calcium at 2.81% and potassium at 5.69%, second only to the Siberian Altai at 6.81%.
Boron, at 142 mg/kg, is also the highest across our range, and is characteristic of the evaporite and sedimentary deposits of the region. Mineral data of this kind functions as a geographic fingerprint rather than simply a quality metric: a profile inconsistent with the claimed origin is a meaningful red flag, while one consistent with it is a supporting data point that a mislabelled product would struggle to reproduce.
The humic to fulvic ratio here, 7.08% humic against 41.84% fulvic, sits in the middle of our range.
| Compound | Result |
|---|---|
| Fulvic acids | 41.84% w/w |
| Humic acids | 7.08% w/w |
| Element | Method | As reported | mg/kg |
|---|---|---|---|
| Potassium (K) | PN-EN ISO 11885:2009 (E) | 5.69% w/w | 56,900 |
| Calcium (Ca) | PN-EN ISO 11885:2009 (E) | 2.81% w/w | 28,100 |
| Magnesium (Mg) | PN-EN ISO 11885:2009 (E) | 1.49% w/w | 14,900 |
| Iron (Fe) | PN-EN ISO 11885:2009 (E) | 411 mg/kg | 411 |
| Boron (B) | PN-EN ISO 11885:2009 (E) | 142 mg/kg | 142 |
| Phosphorus (P) | PN-EN ISO 11885:2009 (E) | 138 mg/kg | 138 |
| Sodium (Na) | PN-EN ISO 11885:2009 (E) | 103 mg/kg | 103 |
| Aluminium (Al) | PN-EN ISO 11885:2009 (E) | 64 mg/kg | 64 |
| Manganese (Mn) | PN-EN ISO 11885:2009 (E) | 20 mg/kg | 20 |
| Zinc (Zn) | PN-EN ISO 11885:2009 (E) | 12 mg/kg | 12 |
| Cobalt (Co) | PN-EN ISO 11885:2009 (E) | < 10 mg/kg | < 10 |
| Chromium (Cr) | PN-EN ISO 11885:2009 (E) | < 10 mg/kg | < 10 |
| Copper (Cu) | PN-EN ISO 11885:2009 (E) | < 10 mg/kg | < 10 |
| Lithium (Li) | PN-EN ISO 11885:2009 (E) | < 10 mg/kg | < 10 |
| Nickel (Ni) | PN-EN ISO 11885:2009 (E) | < 10 mg/kg | < 10 |
| Vanadium (V) | PN-EN ISO 11885:2009 (E) | < 10 mg/kg | < 10 |
| Selenium (Se) | PN-EN ISO 11885:2009 (E) | < 10 mg/kg | < 10 |
| Zirconium (Zr) | ICP-MS | < 1 mg/kg | < 1 |
Eighteen elements. Potassium, calcium and magnesium are reported as percentages on the certificate and convert to the four- and five-figure mg/kg values shown, which is why they dominate the profile despite appearing as small numbers.
| Element | Method | Result |
|---|---|---|
| Lead (Pb) | ICP-MS | < 1 mg/kg |
| Arsenic (As) | ICP-MS | < 1 mg/kg |
| Cadmium (Cd) | ICP-MS | < 0.2 mg/kg |
| Mercury (Hg) | ICP-MS | < 0.2 mg/kg |
All four returned below the method's limit of detection. These reports state the method but don't carry an accreditation marking, unlike the earlier Gdansk certificates further up this page. We've asked EkotechLAB to confirm whether these determinations sit within their PCA scope, and we'll update this note when they reply.
| Determination | Method | Result |
|---|---|---|
| Water content | Weight method | 4.67% w/w |
| Analyte | Result |
|---|---|
| Aflatoxin B1 | < 0.05 µg/kg |
| Aflatoxin B2 | < 0.050 µg/kg |
| Aflatoxin G1 | < 0.05 µg/kg |
| Aflatoxin G2 | < 0.050 µg/kg |
| Sum of aflatoxins B+G | < 0.05 µg/kg |
| Ochratoxin A | < 0.5 µg/kg |
| Deoxynivalenol | < 60 µg/kg |
| Zearalenone | < 5 µg/kg |
All eight below detection limits. Method PB-296/LF, subcontracted by Nuscana to a laboratory accredited under AB 1095.
What's dated here, and what's coming
The water content and mycotoxin results above were run on the batch analysed in May 2026. They don't describe the same batch as the September 2026 humic, mineral and heavy metal figures higher up this section.
We've kept them because they're the most recent results we hold for those two analyses, and a dated result that's clearly labelled tells you more than a blank space. But they're dated, and we'd rather say so here than let the section heading imply otherwise.
Fresh water content testing has been commissioned on the current batch, along with microbiology for this origin for the first time. When those results arrive they replace what's shown above, and the dates on this section move with them.

Mongolian Altai
Tested by EkotechLAB R&D Laboratory, Straszyn, Poland. Analysis Report S/572b/26, laboratory sample SP 1669/26, customer labelling MONGOLIAN. Sampled and delivered 1 September 2026, analysis completed 18 September 2026. Samples were collected by the laboratory from the entire production batch.
The Altai range spans four countries, and the Mongolian section carries more sedimentary and volcanic influence than the Precambrian formations further north in Siberia. The profiles diverge accordingly, which is the point of testing each origin separately rather than treating a mountain range as a single source.
Phosphorus at 1,008 mg/kg and aluminium at 282 mg/kg are both second in the range, behind the Siberian Altai at 1,700 and 1,200 mg/kg. Those Siberian figures are printed on the certificate as 0.17% and 0.12%, which is exactly why converting to one unit matters before comparing. Potassium and calcium sit close to the Kashmiri, but the Mongolian carries considerably more phosphorus and manganese and far less boron.
At 51.93% fulvic against 10.19% humic, this origin holds a comparatively strong humic figure alongside a high fulvic result, which is the combination we find most interesting on a certificate.
| Compound | Result |
|---|---|
| Fulvic acids | 51.93% w/w |
| Humic acids | 10.19% w/w |
| Element | Method | As reported | mg/kg |
|---|---|---|---|
| Potassium (K) | PN-EN ISO 11885:2009 (E) | 3.59% w/w | 35,900 |
| Calcium (Ca) | PN-EN ISO 11885:2009 (E) | 2.96% w/w | 29,600 |
| Magnesium (Mg) | PN-EN ISO 11885:2009 (E) | 1.51% w/w | 15,100 |
| Phosphorus (P) | PN-EN ISO 11885:2009 (E) | 1,008 mg/kg | 1,008 |
| Aluminium (Al) | PN-EN ISO 11885:2009 (E) | 282 mg/kg | 282 |
| Iron (Fe) | PN-EN ISO 11885:2009 (E) | 276 mg/kg | 276 |
| Sodium (Na) | PN-EN ISO 11885:2009 (E) | 142 mg/kg | 142 |
| Manganese (Mn) | PN-EN ISO 11885:2009 (E) | 70 mg/kg | 70 |
| Boron (B) | PN-EN ISO 11885:2009 (E) | 69 mg/kg | 69 |
| Zinc (Zn) | PN-EN ISO 11885:2009 (E) | 16 mg/kg | 16 |
| Cobalt (Co) | PN-EN ISO 11885:2009 (E) | < 10 mg/kg | < 10 |
| Chromium (Cr) | PN-EN ISO 11885:2009 (E) | < 10 mg/kg | < 10 |
| Copper (Cu) | PN-EN ISO 11885:2009 (E) | < 10 mg/kg | < 10 |
| Lithium (Li) | PN-EN ISO 11885:2009 (E) | < 10 mg/kg | < 10 |
| Nickel (Ni) | PN-EN ISO 11885:2009 (E) | < 10 mg/kg | < 10 |
| Vanadium (V) | PN-EN ISO 11885:2009 (E) | < 10 mg/kg | < 10 |
| Selenium (Se) | PN-EN ISO 11885:2009 (E) | < 10 mg/kg | < 10 |
| Zirconium (Zr) | ICP-MS | < 1 mg/kg | < 1 |
Eighteen elements. Phosphorus, aluminium and manganese all run higher here than in the Kashmiri, which is consistent with the more volcanic character of the southern Altai.
| Element | Method | Result |
|---|---|---|
| Lead (Pb) | ICP-MS | < 1 mg/kg |
| Arsenic (As) | ICP-MS | < 1 mg/kg |
| Cadmium (Cd) | ICP-MS | < 0.2 mg/kg |
| Mercury (Hg) | ICP-MS | < 0.2 mg/kg |
All four returned below the method's limit of detection. These reports state the method but don't carry an accreditation marking, unlike the earlier Gdansk certificates further up this page. We've asked EkotechLAB to confirm whether these determinations sit within their PCA scope, and we'll update this note when they reply.
Still to come for this origin
The analyses below have been commissioned but the results aren't back yet. We'd rather show the gap than leave you to assume it was covered.
- Water content
- Microbiology

Hindu Kush
Tested by EkotechLAB R&D Laboratory, Straszyn, Poland. Analysis Report S/570/26, laboratory sample SP 1667/26, customer labelling HINDU KUSH. Sampled and delivered 1 September 2026, analysis completed 18 September 2026. Samples were collected by the laboratory from the entire production batch.
The Hindu Kush range runs west from the Karakoram through northern Pakistan and into Afghanistan, and is geologically distinct from both the sedimentary Kashmir basin and the Precambrian formations of the Altai. This is the newest origin in our range and the first set of results for it.
The fulvic acid figure of 59.53% under ISO 19822:2018 is the second highest in our range, behind the Hunza at 64.13%, and it comes with the same trade-off we describe elsewhere on this page. The mineral profile is markedly leaner than the Kashmiri or Mongolian: potassium at 0.62% against 5.69% and 3.59%, calcium at 685 mg/kg against roughly 28,000 and 30,000. Humic acids, at 10.40%, hold up better than they do in a heavily purified resin. Read together, that reads as a more purified resin than our Kashmiri, though not as far down that road as our Hunza.
| Compound | Result |
|---|---|
| Fulvic acids | 59.53% w/w |
| Humic acids | 10.40% w/w |
| Element | Method | As reported | mg/kg |
|---|---|---|---|
| Potassium (K) | PN-EN ISO 11885:2009 (E) | 0.62% w/w | 6,200 |
| Magnesium (Mg) | PN-EN ISO 11885:2009 (E) | 869 mg/kg | 869 |
| Calcium (Ca) | PN-EN ISO 11885:2009 (E) | 685 mg/kg | 685 |
| Phosphorus (P) | PN-EN ISO 11885:2009 (E) | 63 mg/kg | 63 |
| Sodium (Na) | PN-EN ISO 11885:2009 (E) | 58 mg/kg | 58 |
| Iron (Fe) | PN-EN ISO 11885:2009 (E) | 45 mg/kg | 45 |
| Aluminium (Al) | PN-EN ISO 11885:2009 (E) | 27 mg/kg | 27 |
| Boron (B) | PN-EN ISO 11885:2009 (E) | 13 mg/kg | 13 |
| Manganese (Mn) | PN-EN ISO 11885:2009 (E) | 4 mg/kg | 4 |
| Cobalt (Co) | PN-EN ISO 11885:2009 (E) | < 10 mg/kg | < 10 |
| Chromium (Cr) | PN-EN ISO 11885:2009 (E) | < 10 mg/kg | < 10 |
| Copper (Cu) | PN-EN ISO 11885:2009 (E) | < 10 mg/kg | < 10 |
| Lithium (Li) | PN-EN ISO 11885:2009 (E) | < 10 mg/kg | < 10 |
| Nickel (Ni) | PN-EN ISO 11885:2009 (E) | < 10 mg/kg | < 10 |
| Vanadium (V) | PN-EN ISO 11885:2009 (E) | < 10 mg/kg | < 10 |
| Zinc (Zn) | PN-EN ISO 11885:2009 (E) | < 10 mg/kg | < 10 |
| Selenium (Se) | PN-EN ISO 11885:2009 (E) | < 10 mg/kg | < 10 |
| Zirconium (Zr) | ICP-MS | < 1 mg/kg | < 1 |
Eighteen elements. Note how much smaller the mineral fraction is here than in the Kashmiri or Mongolian profiles once everything is converted to mg/kg. That's what a more purified resin looks like on a certificate.
| Element | Method | Result |
|---|---|---|
| Lead (Pb) | ICP-MS | < 1 mg/kg |
| Arsenic (As) | ICP-MS | < 1 mg/kg |
| Cadmium (Cd) | ICP-MS | < 0.2 mg/kg |
| Mercury (Hg) | ICP-MS | < 0.2 mg/kg |
All four returned below the method's limit of detection. These reports state the method but don't carry an accreditation marking, unlike the earlier Gdansk certificates further up this page. We've asked EkotechLAB to confirm whether these determinations sit within their PCA scope, and we'll update this note when they reply.
Still to come for this origin
The analyses below have been commissioned but the results aren't back yet. We'd rather show the gap than leave you to assume it was covered.
- Water content
- Microbiology

Certificate dates, batches, and what we can't claim
You'll have noticed the dates above don't match. Kashmiri, Mongolian Altai and Hindu Kush were analysed in September 2026, Siberian Altai in late 2025, and Hunza in early 2024. The Kashmiri water content and mycotoxin results are older still, from the batch analysed in May 2026, and are labelled as such in that section. That's worth explaining rather than leaving you to guess.
A certificate covers the batch it was drawn from, not a period of time. It doesn't expire on an anniversary. If the batch hasn't changed, the analysis still describes what's in the jar. What differs between our origins isn't how often we test, it's how quickly each one sells. Hunza is our slowest seller, so a single batch has lasted a long time. We test each new batch before it goes on sale and replace the certificates here when we do. The certificates on this page identify the laboratory sample reference rather than the lot code printed on your jar, so if you want to confirm which certificate covers the jar you have, contact us with the lot code and we'll tell you.
Storage matters over that kind of timescale, so here's what we actually do. Material arrives and stays in individually sealed one-kilogram bags. A bag is opened only when we're jarring from it, and the rest stay sealed until their turn. Shilajit is a low-moisture geological material; our Hunza sample measured 2.57% water content. Sealed storage helps limit moisture uptake and air exposure over time.
Here's the part most brands would leave out. We believe that keeps the resin stable. We haven't proved it. We haven't run formal stability testing, and we haven't re-analysed a stored batch after two years to demonstrate the composition hasn't shifted. The reasoning is sound and the storage is careful, but reasoning isn't data, and we've spent this whole page arguing that the difference matters.
Several things on this page are still moving, and we'd rather list them than let you find the gaps yourself. Water content and microbiology are outstanding for the Hindu Kush and for the current Mongolian Altai batch. The Kashmiri water content and mycotoxin figures shown above are from its May 2026 batch, and both are being re-run on the current one, with microbiology added for that origin for the first time. The Hunza batch is near its end and its replacement will be tested the same way. In each case the results here get replaced when the new ones arrive, and the dates move with them.
Shop the range
Ready to choose your origin?
Browse our full range of Shilajit resin, each independently tested and sourced from its declared region.
Shop Shilajit resinAbout EkotechLAB
EkotechLAB Marek Klein S.K.A. is a specialist analytical chemistry laboratory in Poland, working from its Gdansk and Straszyn sites. The scientists who conduct our analyses are specialists in instrumental analysis, and every certificate on this page names EkotechLAB's own R&D laboratory as the facility that carried out the work.
EkotechLAB holds PCA accreditation (AB 1755), the Polish Centre for Accreditation, under the ILAC-MRA international mutual recognition arrangement, for specified methods. Where a result sits within that scope we say so alongside its certificate. ILAC-MRA membership means the laboratory's accredited results are recognised as technically equivalent to those of accredited laboratories in over 100 countries worldwide.
We don't conduct our own testing or commission testing from laboratories with a commercial interest in the outcome. EkotechLAB has no affiliation with One Life Foods beyond providing analytical services.
If you have questions about our testing programme, the methods used, or the results presented here, you're welcome to contact us directly.
Want to understand how to interpret the methods, units, accreditation details and footnotes shown on a laboratory document? Read our guide to how to read a Shilajit lab report. For a broader explanation of why each category of analysis matters, see how Shilajit testing works.
Last reviewed: October 2026